Thursday, 18 June 2015
Earth's ozone layer on track to recovery, scientists report
The images above show the Antarctic ozone hole on September 16 (the International Day for the Preservation of the Ozone Layer) in the years 1979, 1987, 2006, and 2011. The first two maps are based on data from the Total Ozone Mapping Spectrometer (TOMS) on the Nimbus-7 satellite. The other two maps are made with data from the Ozone Monitoring Instrument on the Aura satellite. Though taken by different instruments, the data sets have all been cross-calibrated and reanalyzed by scientific models. Credit: Images from NASA animation by Robert Simmon, using imagery from the Ozone Hole Watch
Earth's protective ozone layer is well on track to recovery in the next few decades thanks to concerted international action against ozone depleting substances, according to a new assessment by 300 scientists.
The Assessment for Decision-Makers, a summary document of the Scientific Assessment of Ozone Depletion 2014, is being published by the United Nations Environment Programme (UNEP) and the World Meteorological Organization (WMO), and is the first comprehensive update in four years.
The stratospheric ozone layer, a fragile shield of gas, protects Earth from harmful ultraviolet rays of the sun. Without the Montreal Protocol and associated agreements, atmospheric levels of ozone depleting substances could have increased tenfold by 2050. According to global models, the Protocol will have prevented 2 million cases of skin cancer annually by 2030, averted damage to human eyes and immune systems, and protected wildlife and agriculture, according to UNEP.
The phase-out of ozone depleting substances has had a positive spin-off for the global climate because many of these substances are also potent greenhouse gases. However, the assessment report cautions that the rapid increase in certain substitutes, which are themselves also potent greenhouse gases, has the potential to undermine these gains. The assessment also notes that there are possible approaches to avoiding the harmful climate effects of these substitutes.
"There are positive indications that the ozone layer is on track to recovery towards the middle of the century. The Montreal Protocol -- one of the world's most successful environmental treaties -- has protected the stratospheric ozone layer and avoided enhanced UV radiation reaching the earth's surface," said UN Under-Secretary-General and UNEP Executive Director Achim Steiner.
"However, the challenges that we face are still huge. The success of the Montreal Protocol should encourage further action not only on the protection and recovery of the ozone layer but also on climate. On September 23, the UN Secretary General will host Heads of State in New York in an effort to catalyse global action on climate. The Montreal Protocol community, with its tangible achievements, is in a position to provide strong evidence that global cooperation and concerted action are the key ingredients to secure the protection of our global commons," he added.
"International action on the ozone layer is a major environmental success story," said WMO Secretary-General Michel Jarraud. "This should encourage us to display the same level of urgency and unity to tackle the even greater challenge of climate change. This latest assessment provides solid science to policy-makers about the intricate relationship between ozone and climate and the need for mutually-supportive measures to protect life on earth for future generations."
"Human activities will continue to change the composition of the atmosphere. WMO's Global Atmosphere Watch programme will therefore continue its crucial monitoring, research and assessment activities to provide scientific data needed to understand and ultimately predict environmental changes, as it has done for the past 25 years" said Mr Jarraud.
Key findings:
Actions taken under the Montreal Protocol on Substances that Deplete the Ozone Layer are enabling the return of the ozone layer to benchmark 1980 levels.
Under full compliance with the Montreal Protocol, the ozone layer is expected to recover to 1980 benchmark levels- the time before significant ozone layer depletion- before the middle of the century in mid-latitudes and the Arctic, and somewhat later in the Antarctic.
The Montreal Protocol and associated agreements have led to decreases in the atmospheric abundance of gases, such as CFCs (chlorofluorocarbons) and halons, once used in products such as refrigerators, spray cans, insulation foam and fire suppression.
Total column ozone declined over most of the globe during the 1980s and early 1990s. It has remained relatively unchanged since 2000, but there are recent indications of its future recovery.
The Antarctic ozone hole continues to occur each spring and it is expected to continue occurring for the better part of this century given that ozone depleting substances persist in the atmosphere, even though their emissions have ceased.
The Arctic stratosphere in winter/spring 2011 was particularly cold, which led to large ozone depletion as expected under these conditions.
The climate benefits of the Montreal Protocol could be significantly offset by projected emissions of HFCs (hydrofluorocarbons) used to replace ozone depleting substances.
The Montreal Protocol has made large contributions toward reducing global greenhouse gas emissions. In 1987, ozone-depleting substances contributed about 10 gigatonnes CO2-equivalent emissions per year. The Montreal Protocol has now reduced these emissions by more than 90 per cent. This decrease is about five times larger than the annual emissions reduction target for the first commitment period (2008-2012) of the Kyoto Protocol on climate change.
Hydrofluorocarbons (HFCs) do not harm the ozone layer but many of them are potent greenhouse gases. They currently contribute about 0.5 gigatonnes of CO2-equivalent emissions per year. These emissions are growing at a rate of about 7 per cent per year. Left unabated, they can be expected to contribute very significantly to climate change in the next decades.
Replacements of the current mix of high-GWP HFCs with alternative compounds with low GWPs or not-in-kind technologies would limit this potential problem.
The annual Antarctic ozone hole has caused significant changes in Southern Hemisphere surface climate in the summer.
Ozone depletion has contributed to cooling of the lower stratosphere and this is very likely the dominant cause of observed changes in Southern Hemisphere summertime circulation over recent decades, with associated impacts on surface temperature, precipitation, and the oceans.
In the Northern Hemisphere, where the ozone depletion is smaller, there is no strong link between stratospheric ozone depletion and tropospheric climate.
CO2, Nitrous Oxide and Methane will have an increasing influence on the ozone layer
What happens to the ozone layer in the second half of the 21st century will largely depend on concentrations of CO2, methane and nitrous oxide -- the three main long-lived greenhouse gases in the atmosphere. Overall, CO2 and methane tend to increase global ozone levels. By contrast, nitrous oxide, a by-product of food production, is both a powerful greenhouse gas and an ozone depleting gas, and is likely to become more important in future ozone depletion.
The Scientific Assessment Panel is expected to present the key findings of the new report at the annual Meeting of the Parties to the Montreal Protocol, to be held in Paris in November 2014. The full body of the report will be issued in early 2015.
Notes :
The Scientific Assessment of Ozone Depletion 2014 was prepared and reviewed by 282 scientists from 36 countries (Argentina, Australia, Austria, Belgium, Botswana, Brazil, Canada, People's Republic of China, Comoros, Costa Rica, Cuba, Czech Republic, Denmark, Finland, France, Germany, Greece, India, Israel, Italy, Japan, Korea, Malaysia, New Zealand, Norway, Poland, Russia, South Africa, Spain, Sweden, Switzerland, The Netherlands, Togo, United Kingdom, United States of America, Zimbabwe.)
Co-Chairs of the ozone assessment are: Prof. Ayité Lô Nohende Ajavon, Université de Lomé, Togo; Prof. John Pyle, University of Cambridge and National Centre for Atmospheric Science, UK; Dr. Paul Newman, NASA/ Goddard Space Flight Center, USA; Prof. A.R. (Ravi) Ravishankara, Colorado State University, USA.
The pre-print version of the ADM can be downloaded from: http://ozone.unep.org/Assessment_Panels/SAP/SAP2014_Assessment_for_Decision-Makers.pdf
Story Source:
The above post is reprinted from materials provided by United Nations Environment Programme. Note: Materials may be edited for content and length.
Fine particulate air pollution linked to risk of childhood autism
Exposure to fine particulate air pollution during pregnancy through the first two years of a child's life may be associated with an increased risk of the child developing autism spectrum disorder (ASD), a condition that affects one in 68 children, according to a University of Pittsburgh Graduate School of Public Health investigation of children in southwestern Pennsylvania.
The research is funded by The Heinz Endowments and published in the July edition of Environmental Research.
"Autism spectrum disorders are lifelong conditions for which there is no cure and limited treatment options, so there is an urgent need to identify any risk factors that we could mitigate, such as pollution," said lead author Evelyn Talbott, Dr.P.H., professor of epidemiology at Pitt Public Health. "Our findings reflect an association, but do not prove causality. Further investigation is needed to determine possible biological mechanisms for such an association."
Dr. Talbott and her colleagues performed a population-based, case-control study of families with and without ASD living in six southwestern Pennsylvania counties. They obtained detailed information about where the mothers lived before, during and after pregnancy and, using a model developed by Pitt Public Health assistant professor and study co-author Jane Clougherty, Sc.D., were able to estimate individual exposure to a type of air pollution called PM2.5.
This type of pollution refers to particles found in the air that are less than 2.5 micrometers in diameter, or 1/30th the average width of a human hair. PM2.5 includes dust, dirt, soot and smoke. Because of its small size, PM2.5 can reach deeply into the lungs and get into the blood stream. Southwestern Pennsylvania has consistently ranked among the nation's worst regions for PM2.5 levels, according to data collected by the American Lung Association.
"There is increasing and compelling evidence that points to associations between Pittsburgh's poor air quality and health problems, especially those affecting our children and including issues such as autism spectrum disorder and asthma," said Grant Oliphant, president of The Heinz Endowments. "While we recognize that further study is needed, we must remain vigilant about the need to improve our air quality and to protect the vulnerable. Our community deserves a healthy environment and clean air."
Autism spectrum disorders are a range of conditions characterized by social deficits and communication difficulties that typically become apparent early in childhood. Reported cases of ASD have risen nearly eight-fold in the last two decades. While previous studies have shown the increase to be partially due to changes in diagnostic practices and greater public awareness of autism, this does not fully explain the increased prevalence. Both genetic and environmental factors are believed to be responsible.
Dr. Talbott and her team interviewed the families of 211 children with ASD and 219 children without ASD born between 2005 and 2009. The families lived in Allegheny, Armstrong, Beaver, Butler, Washington and Westmoreland counties. Estimated average exposure to PM2.5 before, during and after pregnancy was compared between children with and without ASD.
Based on the child's exposure to concentrations of PM2.5 during the mother's pregnancy and the first two years of life, the Pitt Public Health team found that children who fell into higher exposure groups were at an approximate 1.5-fold greater risk of ASD after accounting for other factors associated with the child's risk for ASD -- such as the mother's age, education and smoking during pregnancy. This risk estimate is in agreement with several other recent investigations of PM2.5 and autism.
A previous Pitt Public Health analysis of the study population revealed an association between ASD and increased levels of air toxics, including chromium and styrene. Studies by other institutions using different populations also have associated pollutants with ASD.
"Air pollution levels have been declining since the 1990s; however, we know that pockets of increased levels of air pollution remain throughout our region and other areas," said Dr. Talbott. "Our study builds on previous work in other regions showing that pollution exposures may be involved in ASD. Going forward, I would like to see studies that explore the biological mechanisms that may underlie this association."
Story Source:
The above post is reprinted from materials provided by University of Pittsburgh Schools of the Health Sciences. Note: Materials may be edited for content and length.
Journal Reference:
Evelyn O. Talbott, Vincent C. Arena, Judith R. Rager, Jane E. Clougherty, Drew R. Michanowicz, Ravi K. Sharma, Shaina L. Stacy. Fine particulate matter and the risk of autism spectrum disorder. Environmental Research, 2015; 140: 414 DOI: 10.1016/j.envres.2015.04.021
Wednesday, 17 June 2015
Air Monitoring in Malaysia
The Malaysian Meteorological Service Air Pollution Monitoring Network comprises a total of 22 stations well distributed over Peninsular Malaysia and East Malaysia. This network was started in 1976 with only two stations, but gradually over the years more stations were added. At the same time, as the need arises, more parameters have been added to the observation programme at selected stations. Most of the stations are located some distance from urban centers, thus ensuring that only ambient conditions are monitored .
Most of these stations are co-located with climatologically stations so that simultaneous and continuous observation of both meteorological and air pollution parameters are carried out. This would ensure that a comprehensive data set comprising of both air quality and meteorological data would be available for assessment of any air pollution event.
The Environmental Studies Division is responsible for monitoring and assessing the air quality of the country through the network. Data from the network is also used to document long-term trends and providing early warning of environmental disasters.
The parameters measured by the Division are:
Rainwater Acidity
Aerosols
Atmospheric Ozone
Reactive Gases

Trends of PM10 and O3 in Malaysia of 2013
According to Malaysia Environmental Quality Report in 2013, Five (5) air pollutants consisting of particulate matter (PM10), ozone (O3), sulphur dioxide (SO2), nitrogen dioxide (NO2) and carbon monoxide (CO) were monitored continuously at 52 locations. The air quality trend for the period of 1999 to 2013 was computed by taking the yearly average measurement from the monitoring sites and cross-referencing with Malaysia Ambient Air Quality Guidelines as shown in Table 1.2.
Particulate Matter (PM10)
In 2013, the annual average value of PM10 in the ambient air was 44 µg/m3, which is below the Malaysian Ambient Air Quality Guidelines value of 50 µg/m3. The concentrations for 2013 increased slightly by two (2) percent compared to 2012. Incidences of local peat land fires and transboundary smoke haze had contributed to the higher PM10 recorded intermittently in several areas in Johor, Melaka and Negeri Sembilan from June to September 2013. The trend of the annual average levels of PM10 concentration in the ambient air between 1999 and 2013 is in accordance with the Malaysian Ambient Air Quality Guidelines as shown in Figure 1.8. Based on land use categories, PM10 concentration was in compliance with the Malaysian Ambient Air Quality Guidelines as shown in Figure 1.8(a).
Ground Level Ozone (O3)
In 2013, the annual average daily maximum one-hour ozone concentrations increased slightly by two (2) percent compared to 2012. However, the overall trend on the annual average daily maximum one-hour ozone concentrations in ambient air from 1999 to 2013 were well below the limit of 0.1 ppm as stipulated in the Malaysian Ambient Quality Guidelines and the trend are as shown in Figure 1.9. Figure 1.9(a) shows the ozone concentration for various land use categories between 1999 and 2013. Urban areas recorded higher levels of ozone due to higher traffic volume and conducive atmospheric
conditions, resulting in its formation. Ozone pollution was also dominant in some rural and sub urban areas due to downwind effect transporting ozone pollution from the sources of ozone precursors namely nitrogen oxides (NOx) and volatile organic compound (VOC) emitted from motor vehicles and industries.
Sources of Air Pollution: Ground Transportation
A number of factors can be identified as influencing the amount of emissions attributable
to the transport sector, and an effective strategy will need to take all these factors into account.
They include:
(a) the amount that vehicles are used in a given country or metropolitan area,
including the extent to which this use can be called “excessive”;
(b) the age of the vehicle fleet
and the technology used within it;
(c) the extent to which vehicles are properly maintained;
(d)
the availability of appropriate fuels and the extent to which they are used properly; and
(e)
atmospheric, climatological and topological conditions.
Four of these factors can be influenced
through policy.
(a) Excessive vehicle use.
Level of activity or vehicle use is an important factor to take into account in the overall analysis of transportation emissions, particularly in those cases where long-run solutions are envisioned to help avoid the development of a problem. In a number of developed countries (where data and information are more readily available), studies have shown that growth in activity has either significantly increased the amount of CO2 emitted in the sector or substantially dampened the reduction of CO2 emissions that would have occurred, the latter because of efficiency improvements during the last three decades of the twentieth century. In the absence of a policy to address vehicle use, growth in vehicle kilometers travelled in developing countries is projected to average between 2.5 and 4 per cent per year between 1990 and 2030. It follows that a central question for policy makers is whether avoiding this growth is possible or desirable. A number of unknown but controversial factors affect this question, including whether growth rates of car use and those of car ownership are necessarily the same, and the extent to which transport activity drives economic growth, rather than being an indicator of it. Excessive car use is a particular and likely manifestation of excessive travel under conditions where a cultural phenomenon of car (or motorcycle) dependence develops, in combination with a number of potential price distortions that favour car use. These might include: fuel subsidies to other sectors with unintended but predictable effects on the transport sector; general subsidies to road users built into the financing of how roads are constructed and maintained, and ancillary services delivered; hidden and fixed costs in road infrastructure and land-use provision, which send unclear price signals to potential travellers; and secondary price distortions in land values that incorporate e or capitalize these other (primary) distortions.
(b) Age of fleet and technology used.
Older vehicles are associated with higher emissions of both global and local pollutants than newer vehicles, both because performance deteriorates as a function of age and because older vehicles are more likely to use obsolete, higher emitting technology.
(c) Poor maintenance of vehicles
Deterioration of emissions characteristics is linked to maintenance practices of owners, particularly for local pollutants, where catalytic exhaust after-treatment technology is used. Misfuelling of catalyst-equipped gasoline vehicles with leaded fuel, even once or twice, can seriously damage the ability of the catalyst to operateproperly, and these catalysts can also degrade over time because of other natural contaminants in fuels. Without an effective system in place to ensure that these systems are well maintained, emissions due to neglecting exhaust after-treatment maintenance are likely to increase.
(d) Unavailability or improper use of appropriate fuels.
Fuel is a factor for a number of reasons. Regulatory authorities may inappropriately specify fuel types for a given area’s conditions, leading to unnecessary emissions of certain kinds of pollutants. Vehicle owners may misfuel, out of ignorance or in response to a poorly established price signal.
Haze Pollution in Malaysia and South East Asia
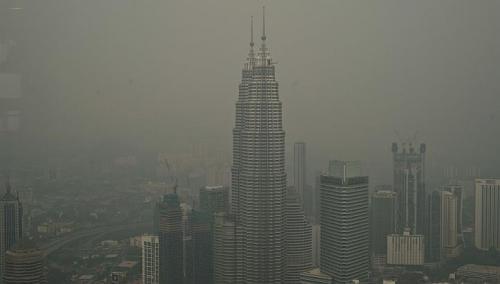
Smoke from land clearing fires in Indonesia causes hazardous haze pollution in South East Asia every year. Record high levels of air pollution caused by haze were reached in June 2013 in Singapore, Malaysia and Indonesia. In response to regional pressure after the latest haze crisis, Indonesia has finally agreed to adopt the ASEAN Agreement on Transboundary Haze Pollution from 2002.
However, the South East Asia still struggle with this problem.
THE HAZE CRISIS
During June 2013 South East Asia was suffering in a cloud of record-breaking haze pollution. The haze, toxic smog caused by fires to clear land for agriculture in Sumatra, Indonesia, exceeded almost three times the hazardous limit for air quality. For a week the most affected areas of Singapore, Malaysia and Indonesia resembled a post-apocalyptic scene – people only dared go out with face masks, schools were closed, the economy took a hit as businesses suspended work, events were cancelled, tourists stayed clear of the area and hospitals faced a surge of respiratory illnesses. The fires also impact climate change because they produce large amounts of greenhouse gas (GHG) emissions from the burning of carbon-rich peatland and forests. To illustrate the magnitude of the problem: the land-clearing fires which cause transboundary haze are also the biggest contributor to Indonesia’s overall GHG emissions. 2013 may have been the worst haze crisis in the region’s recorded history, but similar occurrences are the norm during ‘haze season’ every year since the 1980s.
THE ASEAN AGREEMENT ON TRANSBOUNDARY HAZE
In 2002, the member of ASEAN countries has addressed the this environmental issues by take the world’s first regional agreement against haze as the ASEAN Agreement on Transboundary Haze Pollution.. The Agreement is a legally binding regional environmental treaty that focuses to prevent and mitigate haze pollution ‘through concerted national efforts and intensified regional and international cooperation’. However, two big problems reduce the effectiveness of the Agreement. The first is that Indonesia, the only ASEAN member state yet to ratify the Agreement, is also the main polluter. The second problem concerns the design of the Agreement, which has a weak mechanism for dispute settlement and punishing non-compliance. The Agreement does not prescribe specific sanctions against a signatory country that has infringed its obligations. Instead, Article 27 of the Agreement feebly states that any disputes over non-compliance ‘shall be settled amicably by consultation or negotiation’. In other words, enforcing the Agreement, even over countries that have ratified it, remains a matter of diplomacy, rather than law. It would not provide suffering countries and people with new legal remedies in future outbreaks of haze pollution